Product Guide
Review Data
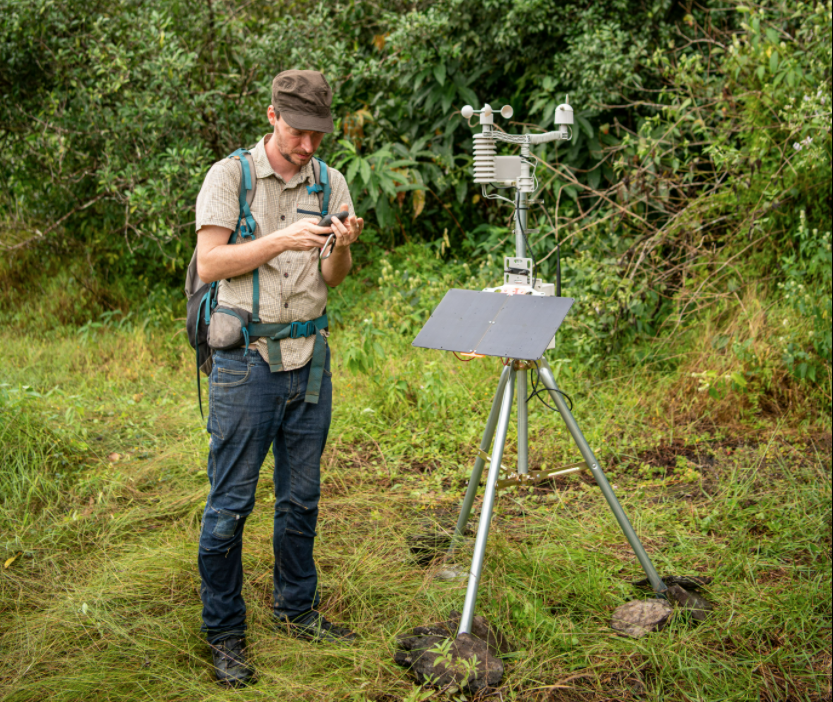
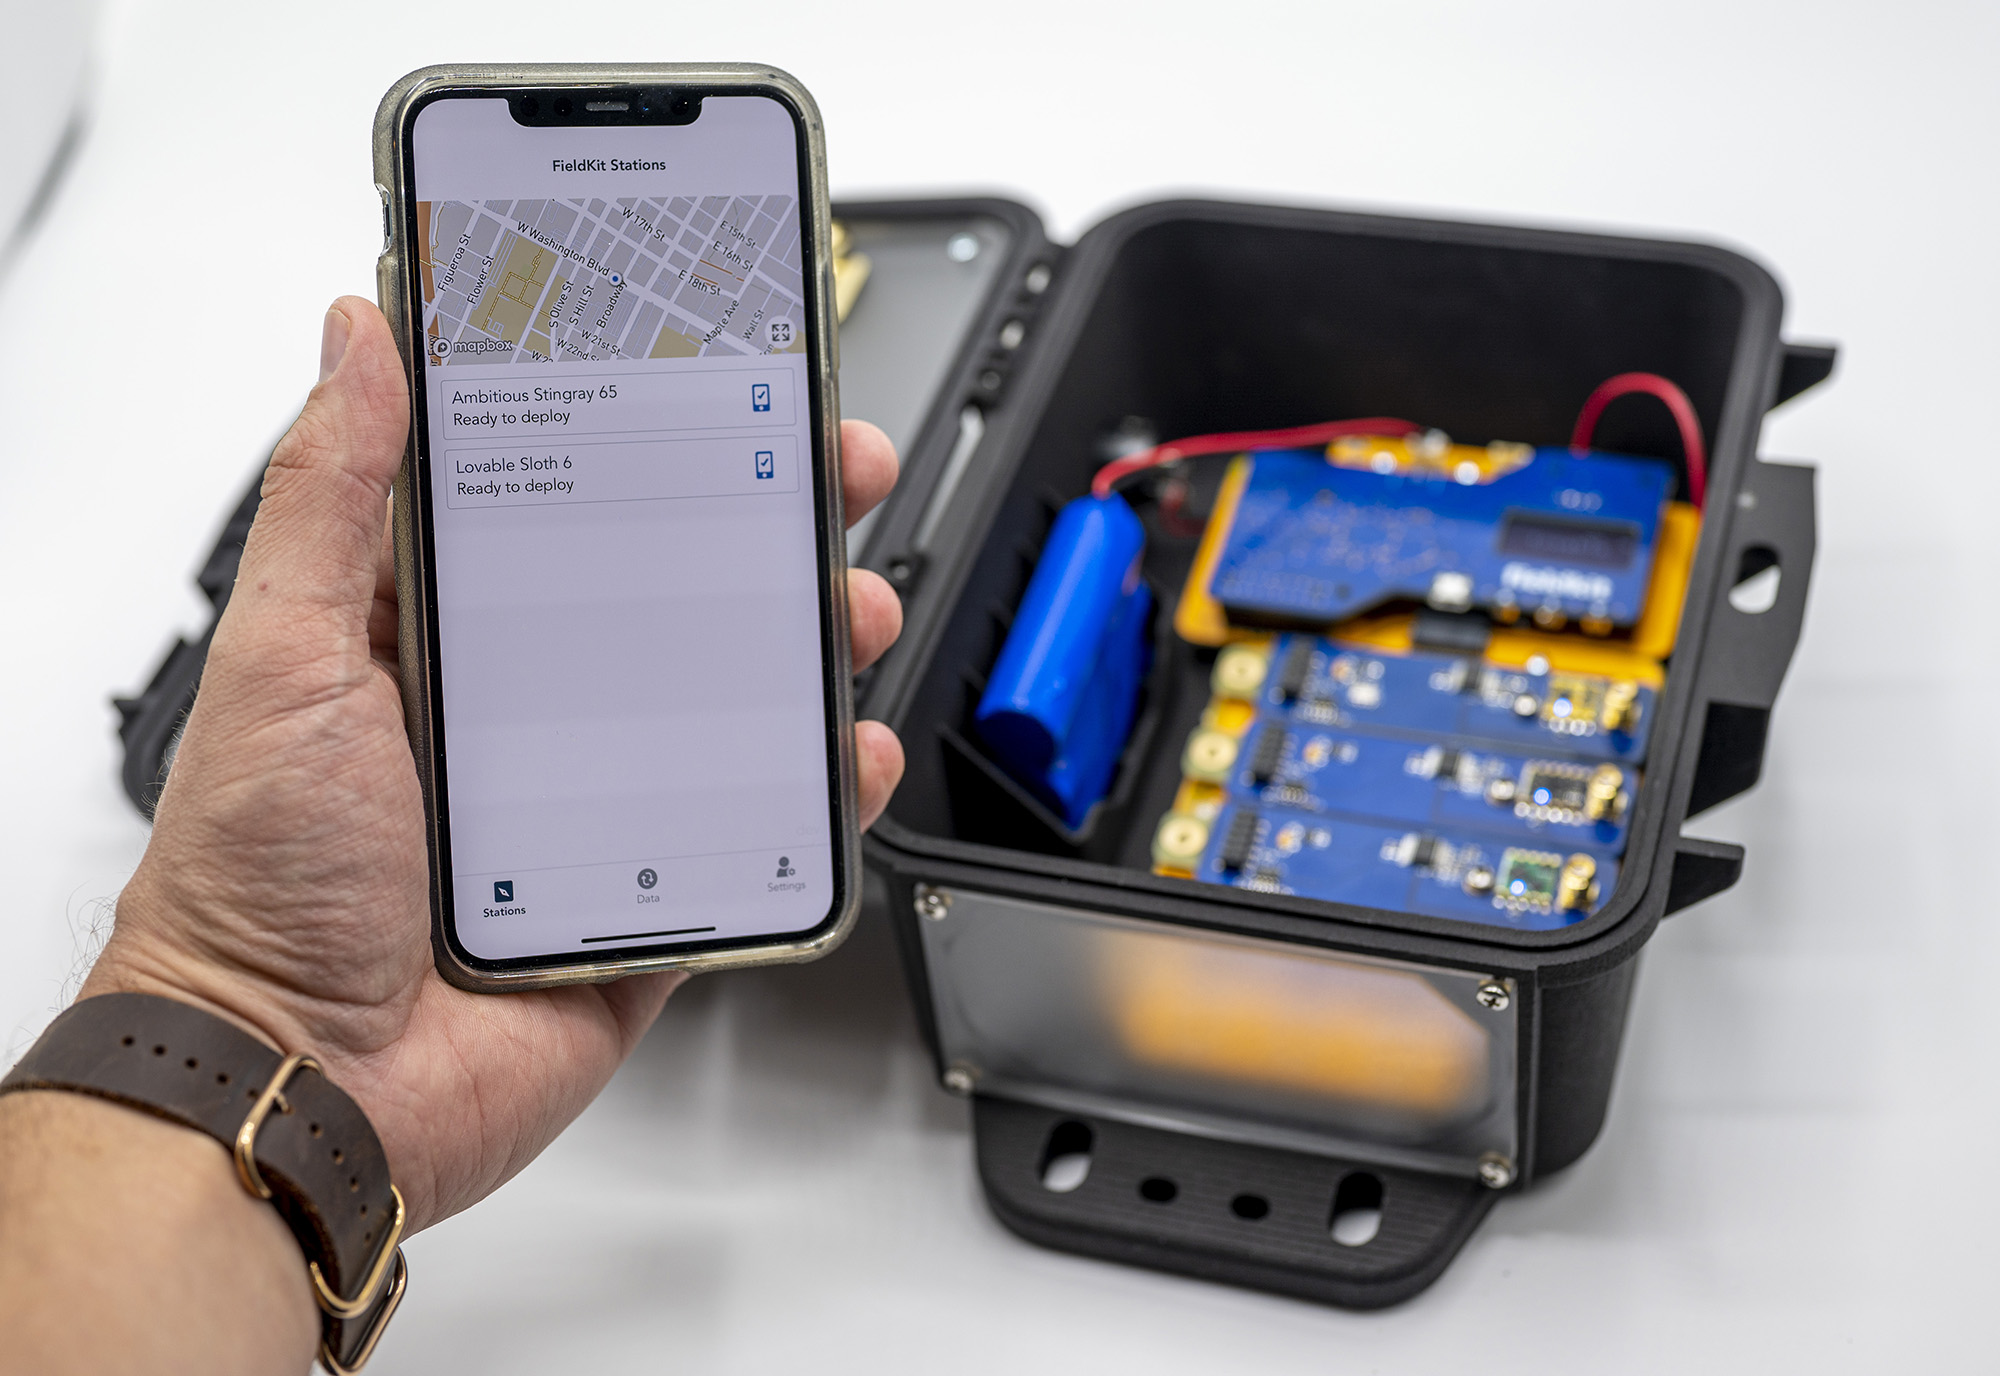
Once your station is installed and your data is synced to both your FieldKit app and the FieldKit web portal, you can easily interact with your data.
Our visualization interface allows you to spot patterns, trends and anomalies, and to flag and share them for collaborators and the FieldKit community. The best experience for reviewing data is on a desktop.
You can review your data on the FieldKit portal by going to portal.fieldkit.org and logging in with the same account you use for the FieldKit app.
We hope you will eventually be able to benefit from the functionality below, but not all of these features are in place yet within the FieldKit web portal. We are working on bringing in data verification and controls.
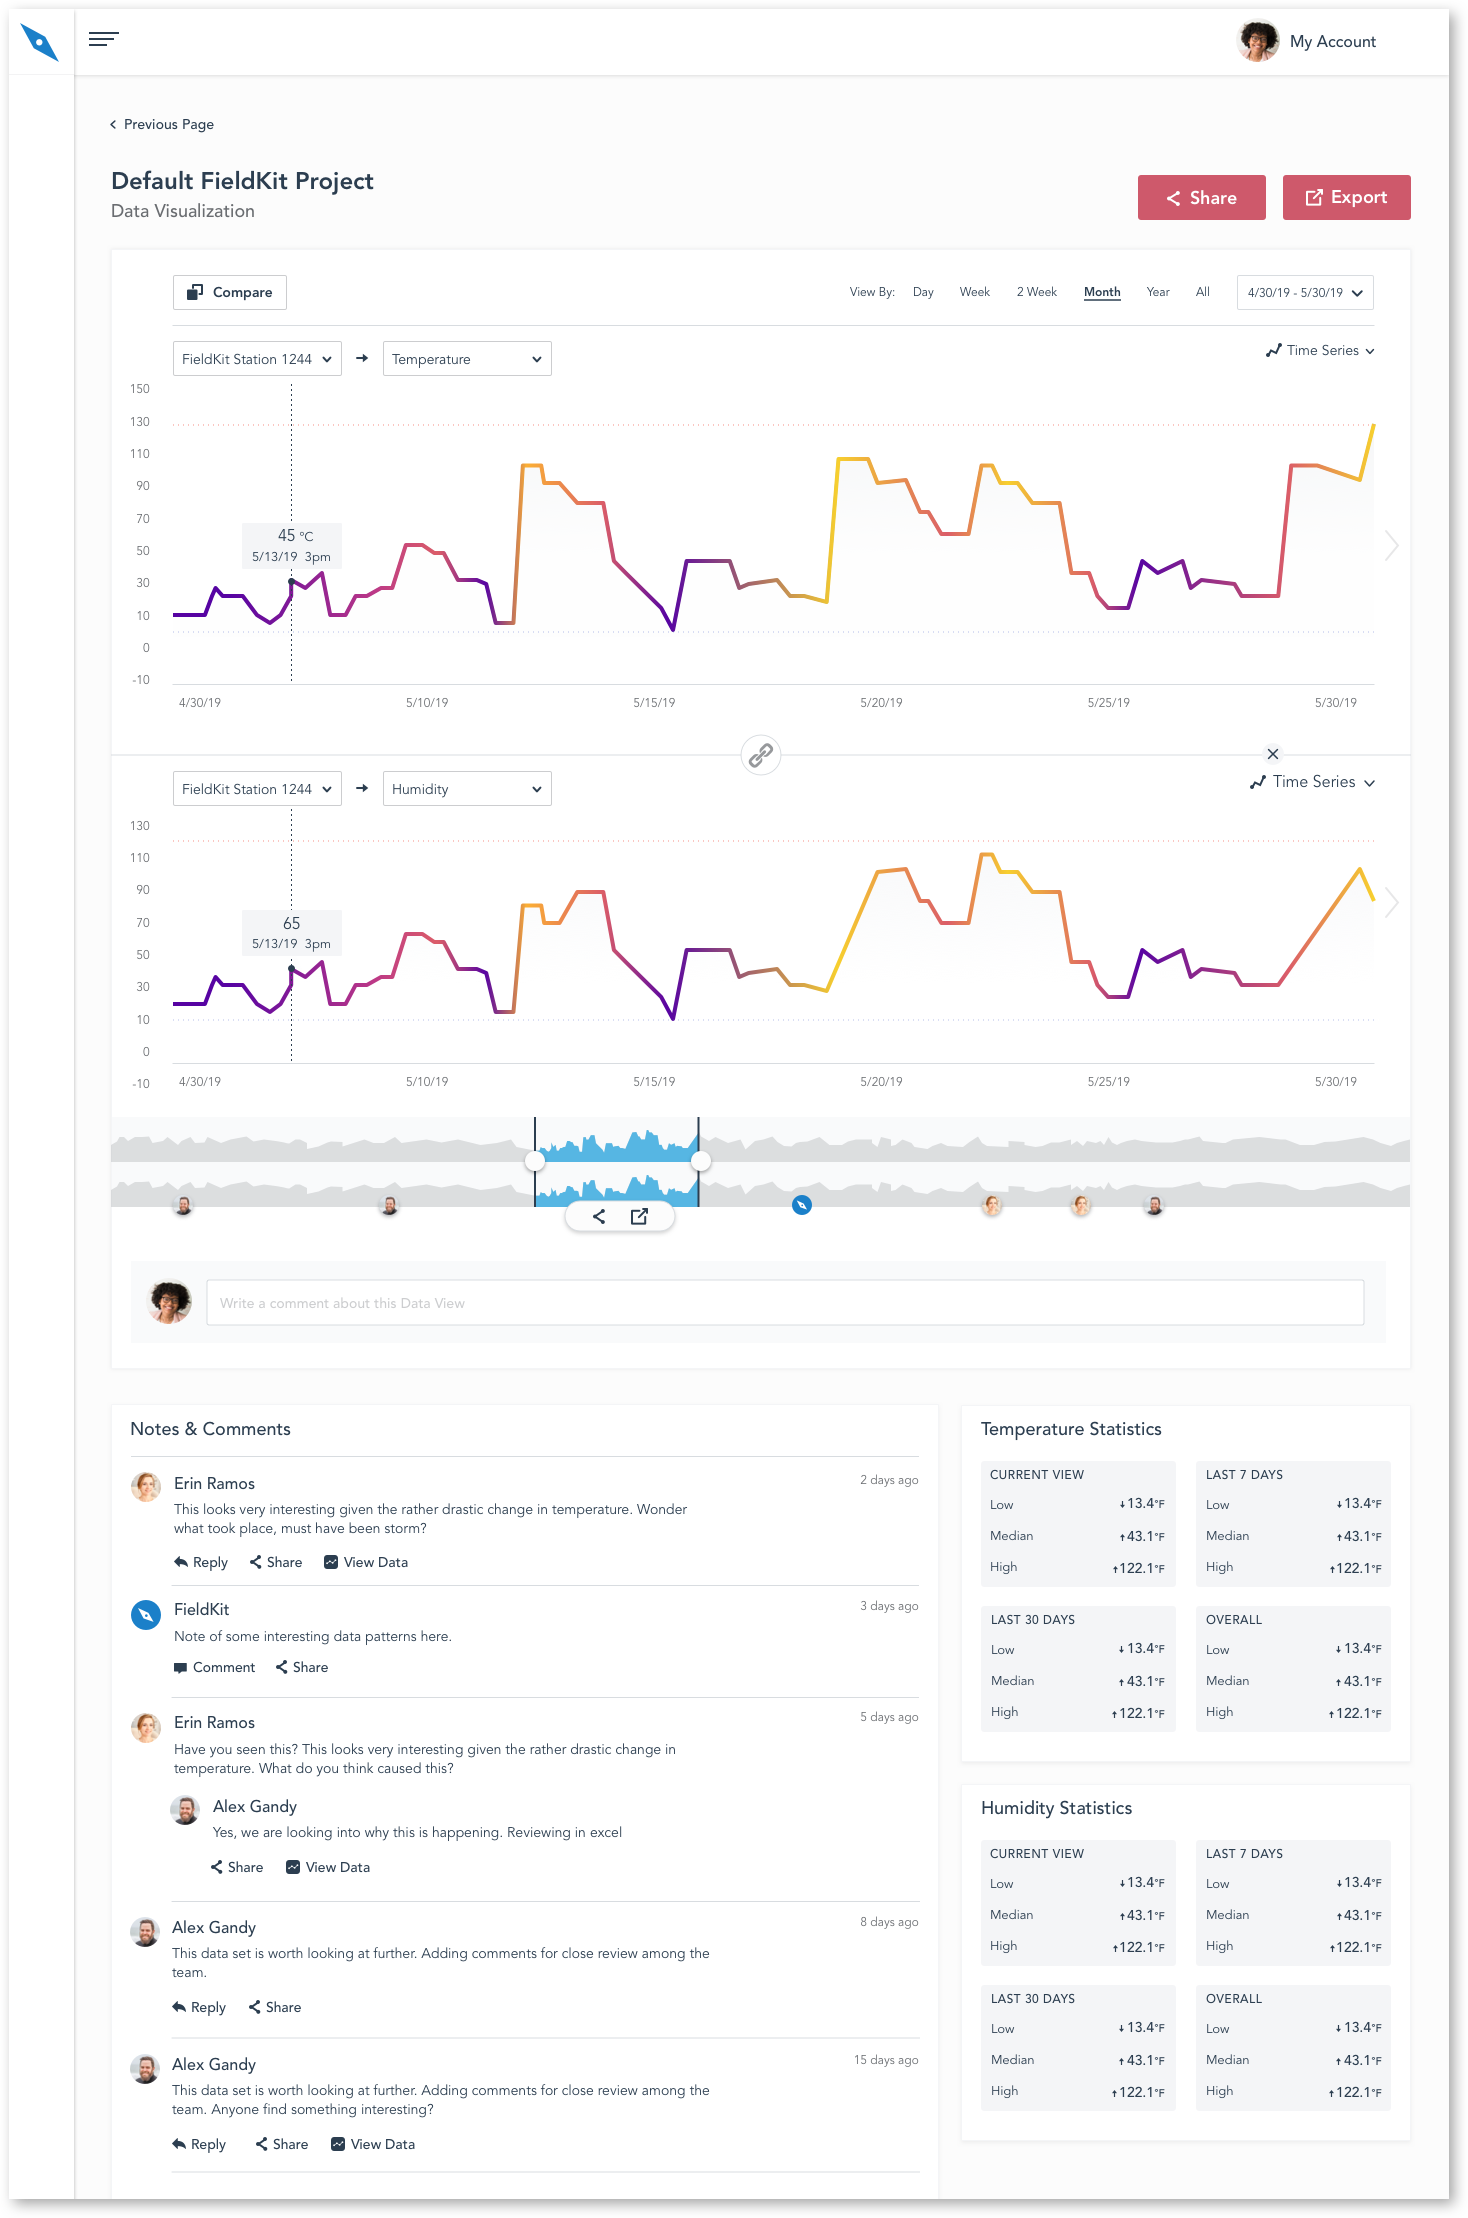
1. Make Comparisons with Data
Data visualizations allow comparison between time periods on one sensor or between different sensors in the same time period. You can compare two sensors on the same chart or have as many charts as you want side-by-side for comparison by using “Add Chart”.
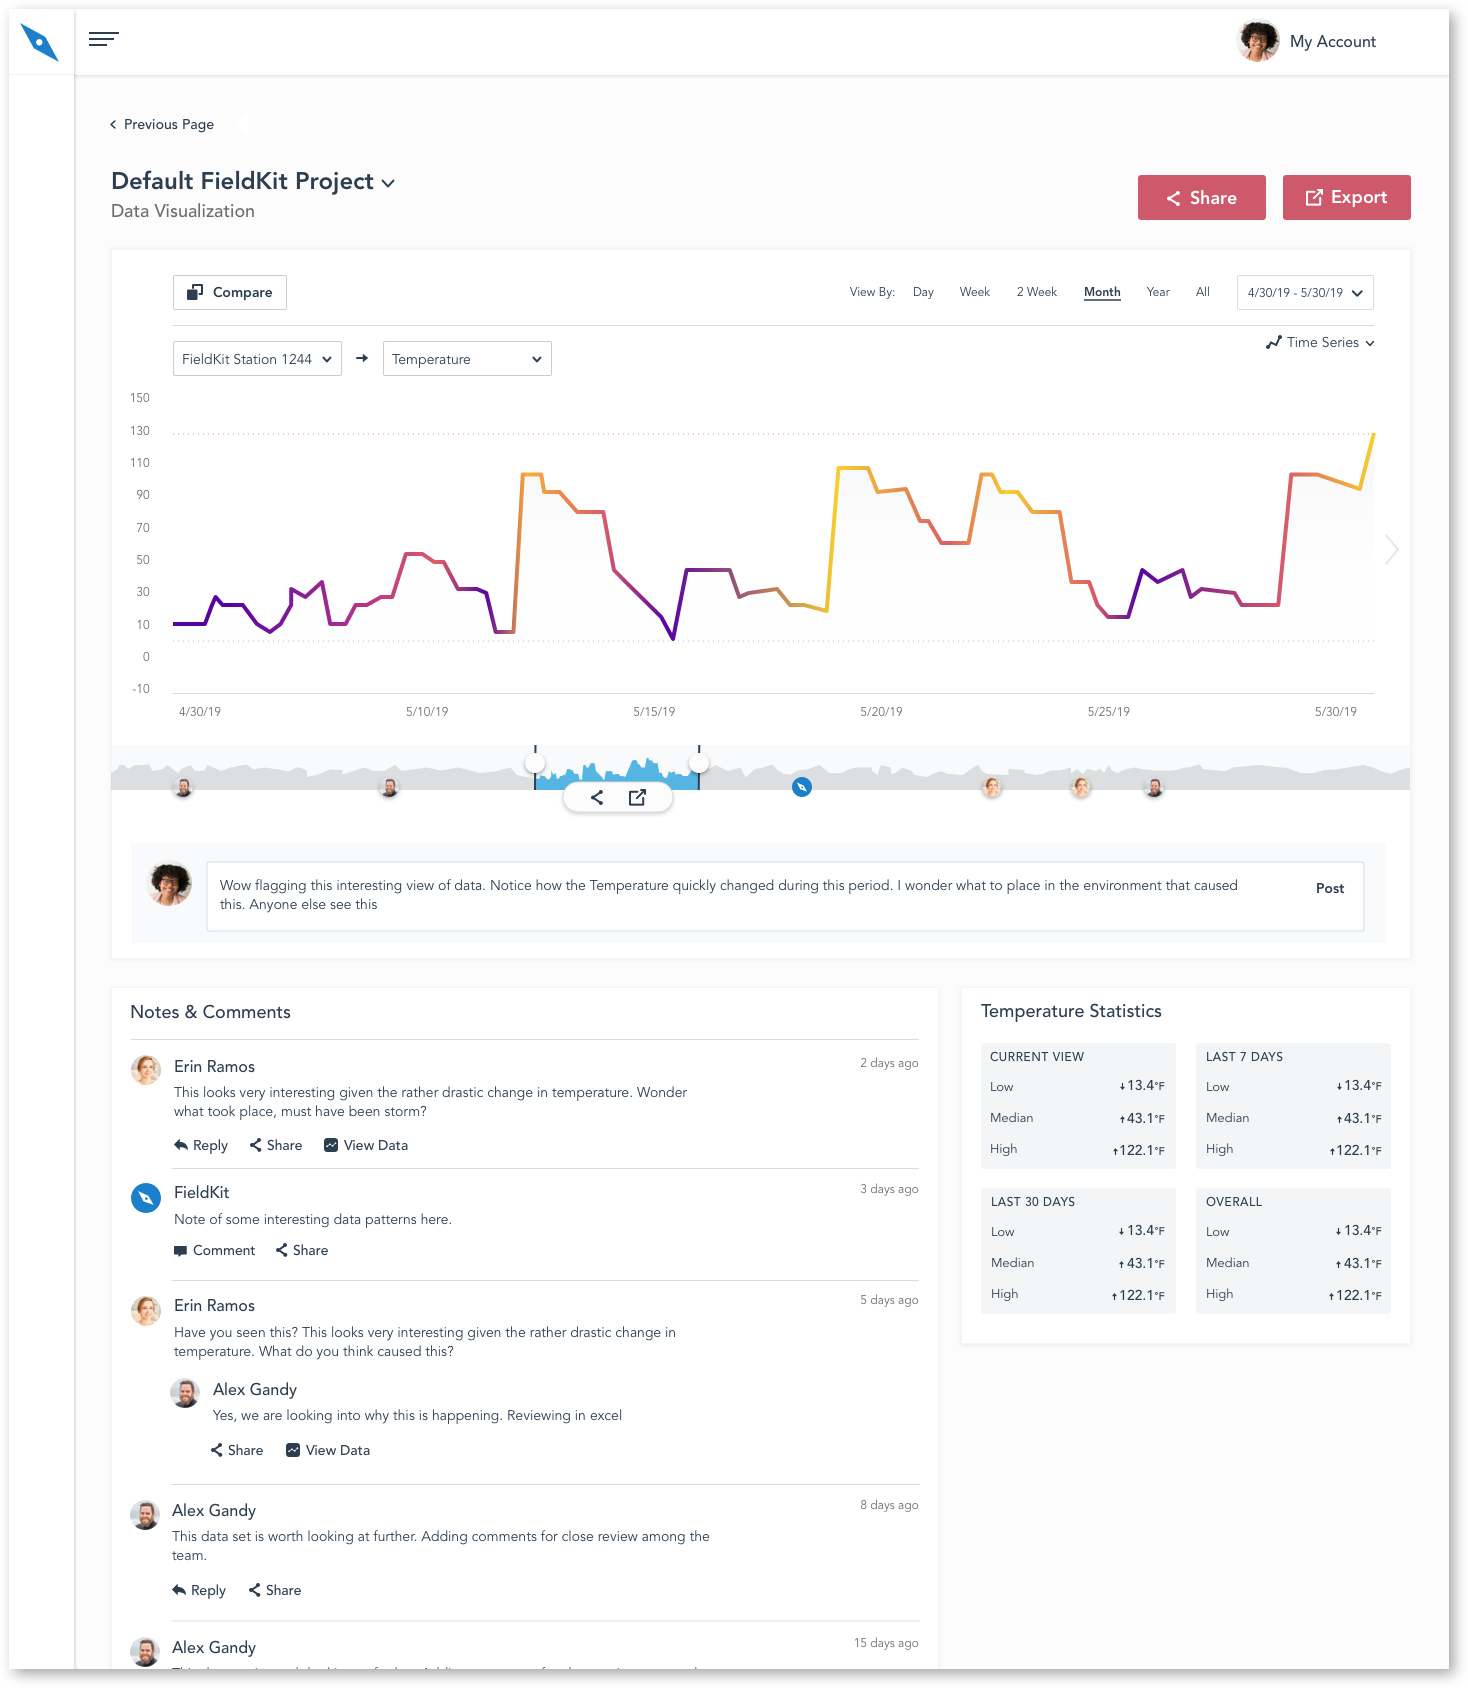
2. Comment on Data
Annotation features allow you to flag and share interesting data within your team or with the broader FieldKit community. You can comment on a particular data view, respond to comments of others, and create a conversation around what you’re seeing in the data.
3. Verify Data (coming soon)
Verify the quality of data by checking the FieldKit metadata. This includes:
- Provenance information
- Verified calibration specs
- Links to details of station installation
4. Control the Fate of Your Data
The data lifespan is not tied to the lifespan of your FieldKit project. You can:
- Backup data to your own device
- Control permissions on who can access the data
- Establish peer-to-peer networks to share your data securely