An Interlude on Debugging
August 22, 2019 | Jacob Lewallen
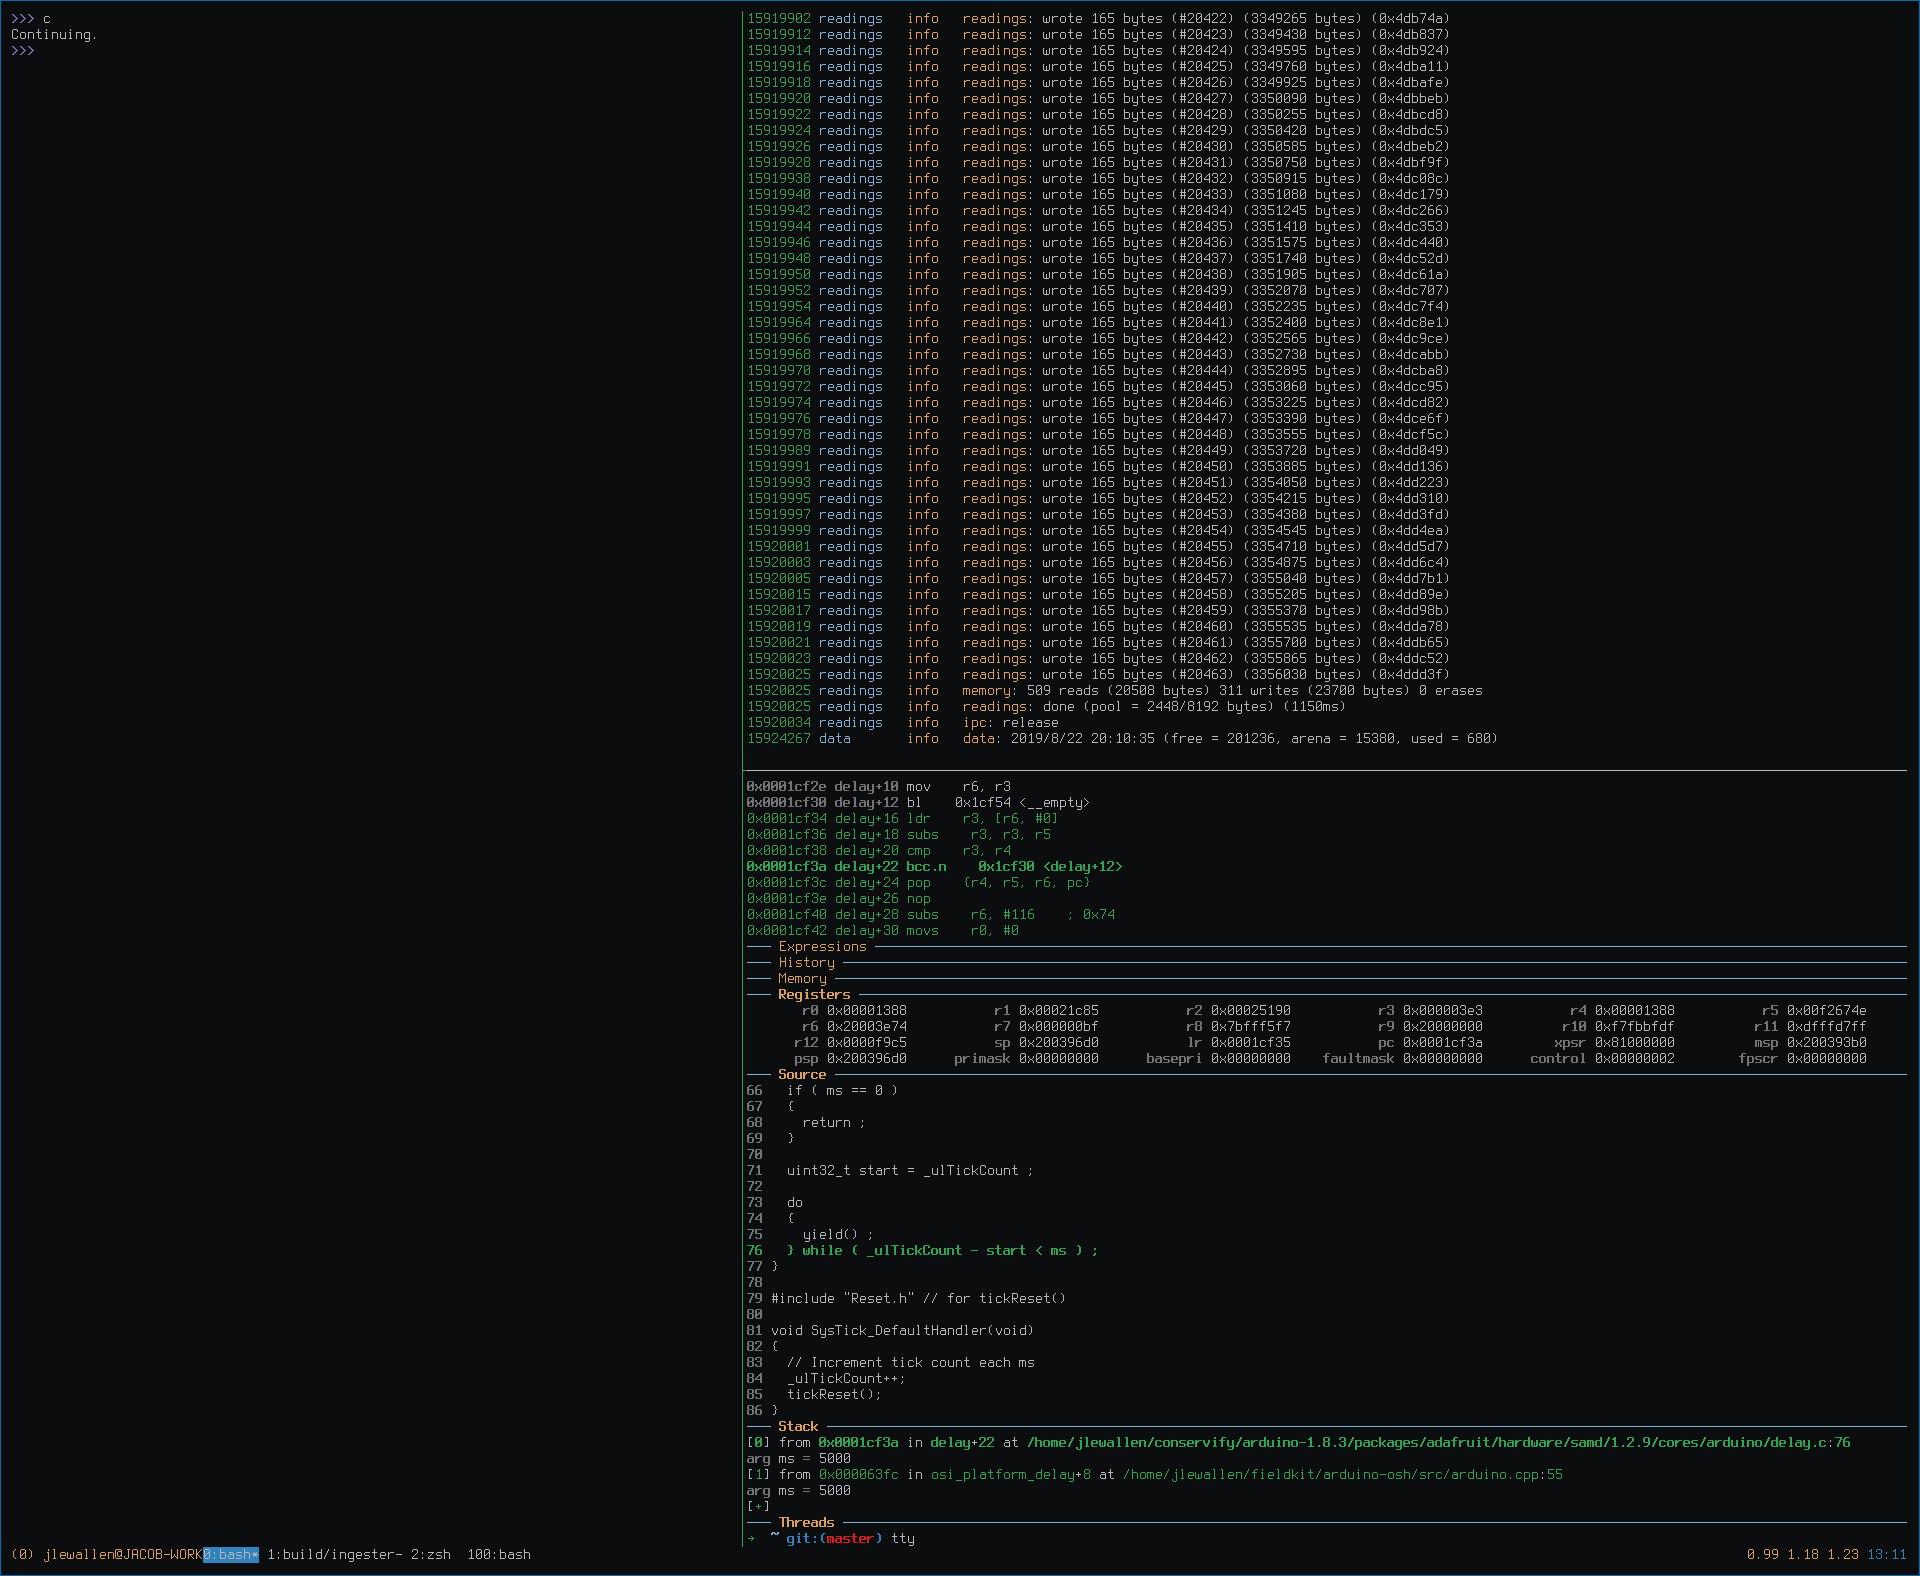
I spent a lot of my waking hours staring at a screen like this.
I wanted to throw together a quick post to talk about some debugging related things I’ve found myself doing more and more that I think others might benefit from. I’m just gonna rattle them off:
- I exclusively load and run firmware from inside GDB. In fact, I now spend all my waking development time inside GDB. Prior to this development cycle I would rely heavily on uploading new firmware over USB, leaning on that functionality being provided by the standard Arduino bootloader. This was annoying in some cases, especially when dealing with hard faults and other serious bugs.
- We use Segger’s JLINK brand of programmers, which I think are fantastic. They are scriptable and very predictable and reliable. Their only downside is you need easy access to a programming connector on your hardware, which Bradley kindly provided to me. Being able to step through and over code and inspect memory is invaluable. I should mention that the Grand Central M4 [1] board by Adafruit comes with this header ready to go, which was awesome before we got our own hardware up.
- The JLink hardware includes some pretty cool additional features. My favorite so far is the RTT “real-time-transfer” functionality [2] Prior to this I would use a dedicated debug UART or USB CDC communications to view the console output from the firmware. Unfortunately, we were clean out of SERCOM peripherals (!) on the new hardware and so had to get creative. It was right around then that I discovered the RTT stuff. Basically, you dedicate a region of your own RAM to hold circular buffers and the JLink programmer is able to find this region and slurp the data for viewing on your host computer. It’s highly configurable and very fast. I’m a huge fan. In fact, I employ a similar linking trick as above to ensure these buffers are in the same location across all binaries so that the logs are seamless among binary transitions, say from the bootloader to the main firmware.
- I write my own custom gdb commands now, typically in Python, for repetitive actions. Especially for things like the build, load, and run flow that I do hundreds of times a day.
- Some GDB commands I like that took me a while to find existed:
| n, s, ni, si | Next, step, next instruction, step instruction. Many of us know these. |
| finish | Run until execution returns from the executing function. |
| b *<address> | Break on a specific instruction, very handy for skipping over loops, for example. |
| disassemble /m | Disassembles the current function. |
| p/x, p/t | Most people know of p/print. You can change the format with these suffixes to print hexadecimal, binary, etc… |
| x/32x, x/32 | Dump memory at the specified location. This is a complex command, like p and so should be looked up. |
I apologize for the formatting of this table, I wish I could do better.
- I’m a big fan of the custom GDB dashboards that are out there, specifically this one [3] There’s so many and you can learn a lot about what’s possible with GDB by reading their source code and tweaking them to your liking.
- I can’t stress how useful Matt Godbolt’s Compiler Explorer is – https://godbolt.org/ It’s a tool I use all the time to get insight into the instructions my compiler is producing, especially when experimenting with C++. You’ll also learn so much about the things going on behind the scenes.
I have a habit of learning just enough of a tool to get by and then halting my learning there. For tools like GDB this is horrible because of the sheer volume of utility lurking behind the common ways people use the tool. I’m trying to do better 🙂
[1] https://www.adafruit.com/product/4064
[2] https://www.segger.com/products/debug-probes/j-link/technology/about-real-time-transfer/